4. Observe the Network
You have a Fabric-X network processing transactions. Now look at it. This lesson opens the dashboards, browses your own blocks, pulls metrics and logs from the command line, and then changes the load so you can watch the network react.
Note
Estimated time: 20 minutes. Requires a running network from 3. Run Your First Network.
What You Will Learn
- Which observability component does what, and which of them are Fabric-X specific.
- How to reach Grafana, Prometheus, and the Block Explorer, and why the scheme is
httpsfor some andhttpfor others. - How to pull metrics and logs without opening a browser at all.
- How to change the transaction rate on a running network.
The Observability Stack
The default local inventory deploys seven observability components. None of them participate in the transaction path — they only watch it.
| Component | Inventory host | Port | Job |
|---|---|---|---|
| Prometheus | prometheus |
9090 | Scrapes and stores metrics from every component |
| Grafana | grafana |
3000 | Dashboards over Prometheus and Loki |
| Loki | loki |
9200 | Stores logs |
| Alloy | alloy |
9300 | Collects logs from the containers and ships them to Loki |
| Node exporter | node-exporter |
9111 | Host-level metrics: CPU, memory, disk, network |
| PostgreSQL exporter | committer-db-exporter |
2110 | Metrics from the committer's database |
| cAdvisor | cadvisor |
9400 | Per-container resource metrics |
flowchart LR
  subgraph TARGETS[Your Fabric-X deployment]
    direction TB
    ORD[Ordering service]
    COM[Committer]
    LG[Load generator]
  end

  subgraph OBS[Observability]
    direction TB
    PROM[Prometheus] -->|metrics| GRAF[Grafana]
    ALLOY[Alloy] -->|logs| LOKI[Loki]
    LOKI -->|logs| GRAF
  end

  ORD -. metrics .-> PROM
  COM -. metrics .-> PROM
  LG -. metrics .-> PROM
  ORD -. logs .-> ALLOY
  COM -. logs .-> ALLOY
  LG -. logs .-> ALLOY
Note where the metrics come from: the orderer components expose them on their orderer_operations_port, the committer services on their committer_metrics_port, and the load generator on its loadgen_metrics_port. Those are inventory values, which you will read for yourself in lesson 5.
Grafana: The Dashboards
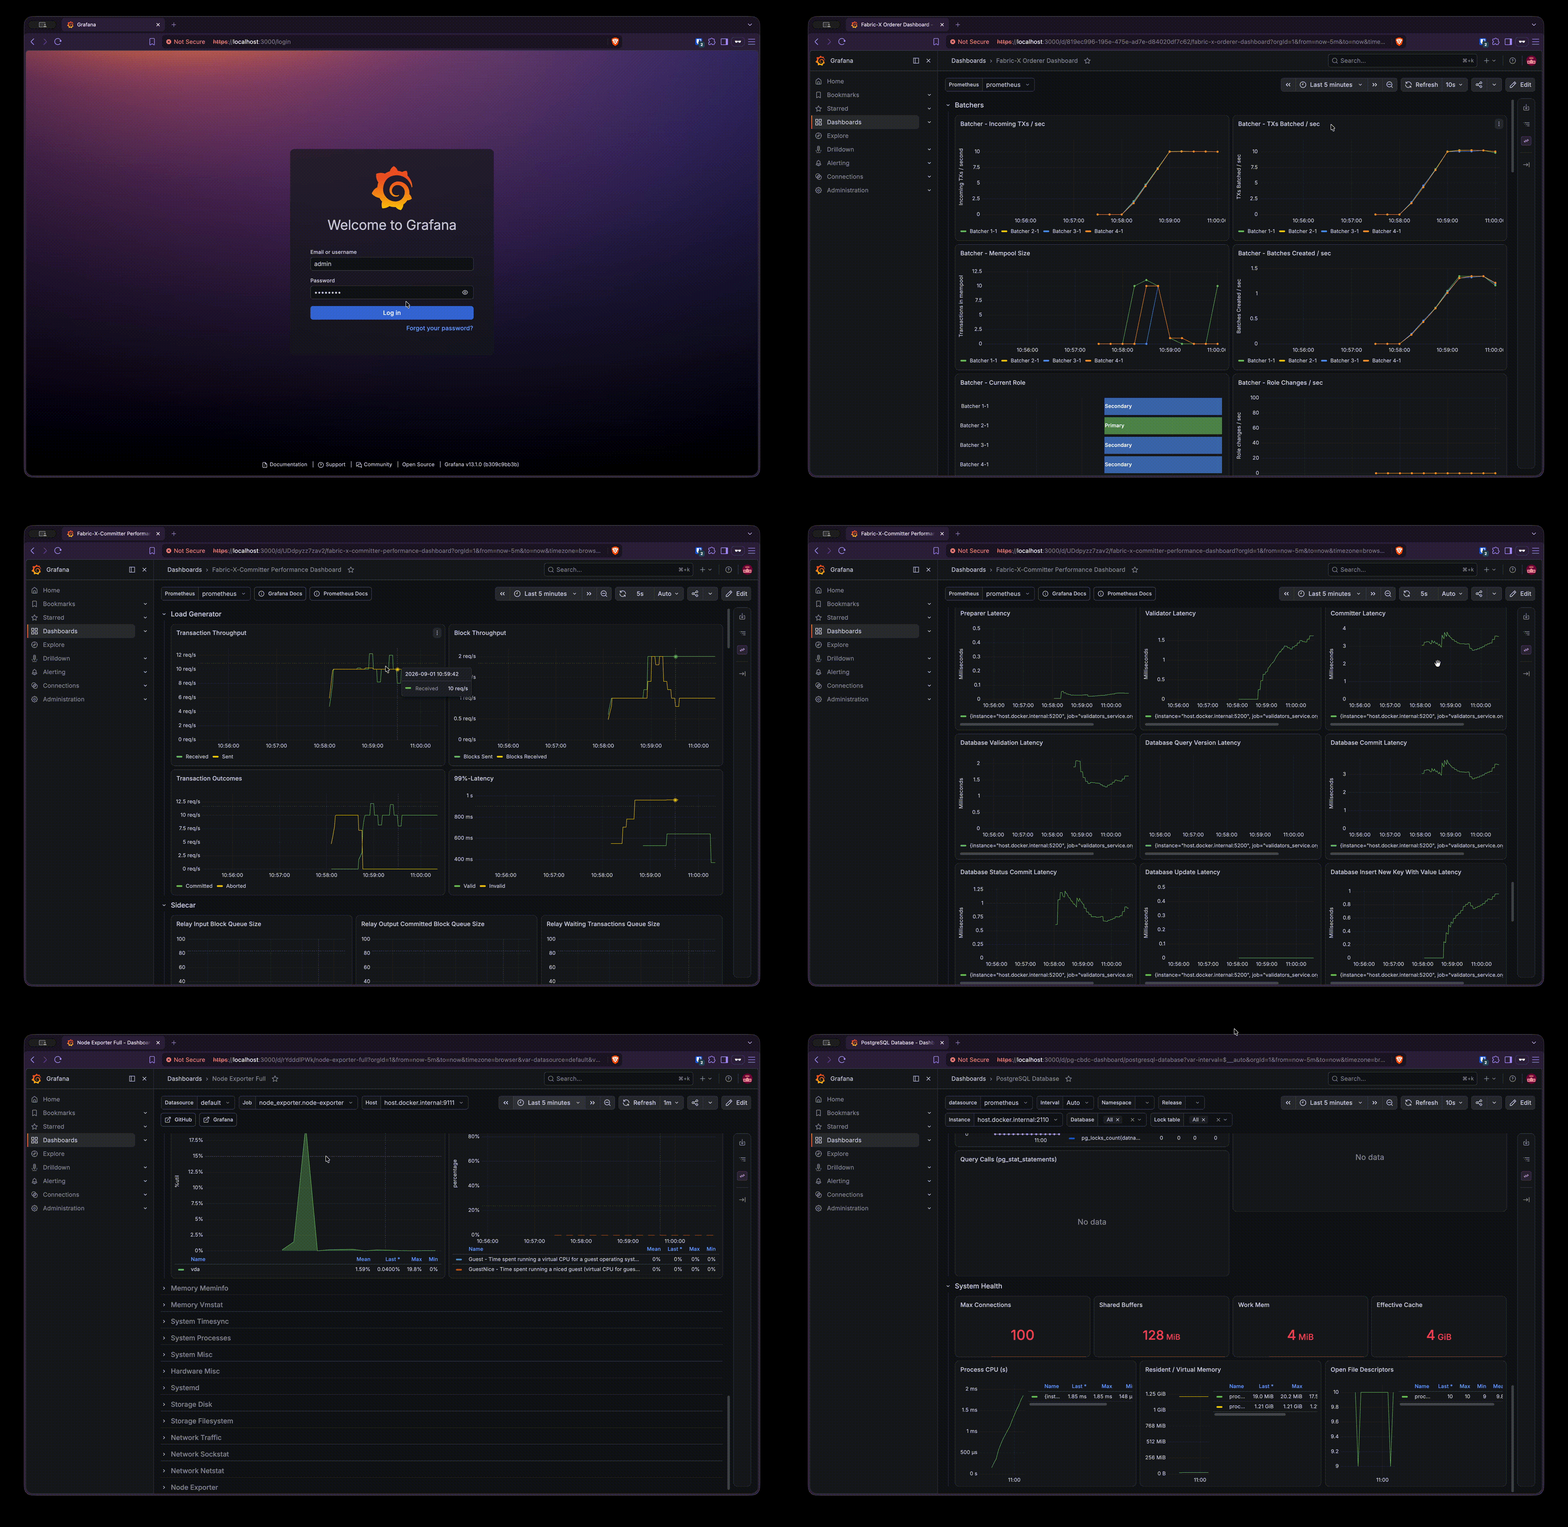
Open https://localhost:3000 and log in with admin / adminPWD.
Warning
Note the https. The default local inventory sets grafana_use_tls: true. Without a configured root CA, Grafana uses a self-signed certificate and your browser will warn you. If you configured OPENSSL_ROOT_CA_CERT_PATH, trust that root on macOS by installing the certificate—not its private key—in the System keychain:
sudo security add-trusted-cert -d -r trustRoot \
  -k /Library/Keychains/System.keychain \
  ~/.fabricx-ca/rootCA.pem
Fully quit and restart the browser after installing it. If you use http://, you will get an empty response and wonder what broke. The admin / adminPWD credentials are sample defaults baked into the example inventory; change grafana_username and grafana_password before using an adapted inventory anywhere shared.
Five dashboards are provisioned automatically. Go to Dashboards and you will find:
| Dashboard | What to look at |
|---|---|
| Fabric-X Orderer Dashboard | Throughput through the routers, batching behaviour, consensus and assembly rates |
| Fabric-X-Committer Performance Dashboard | Validation and commit throughput, transaction status breakdown — this is where you see whether transactions are actually being committed |
| Node Exporter Full | Your machine's CPU, memory, disk, and network |
| cAdvisor Container Insights | Per-container CPU and memory — useful for spotting which service is saturating |
| PostgreSQL Database | Committer database connections, transactions, and cache behaviour |
Start with the Committer Performance Dashboard. A healthy network shows a steady non-zero commit rate. If ordering throughput is non-zero but the commit rate is flat, the problem is on the committer side — exactly the situation that scaling verifiers in lesson 8 addresses.
Tip
Grafana is also wired to Loki as a data source, so you can correlate a metric spike with log lines from the same moment without leaving the dashboard. Use Explore and pick the Loki data source.
Prometheus: The Raw Metrics
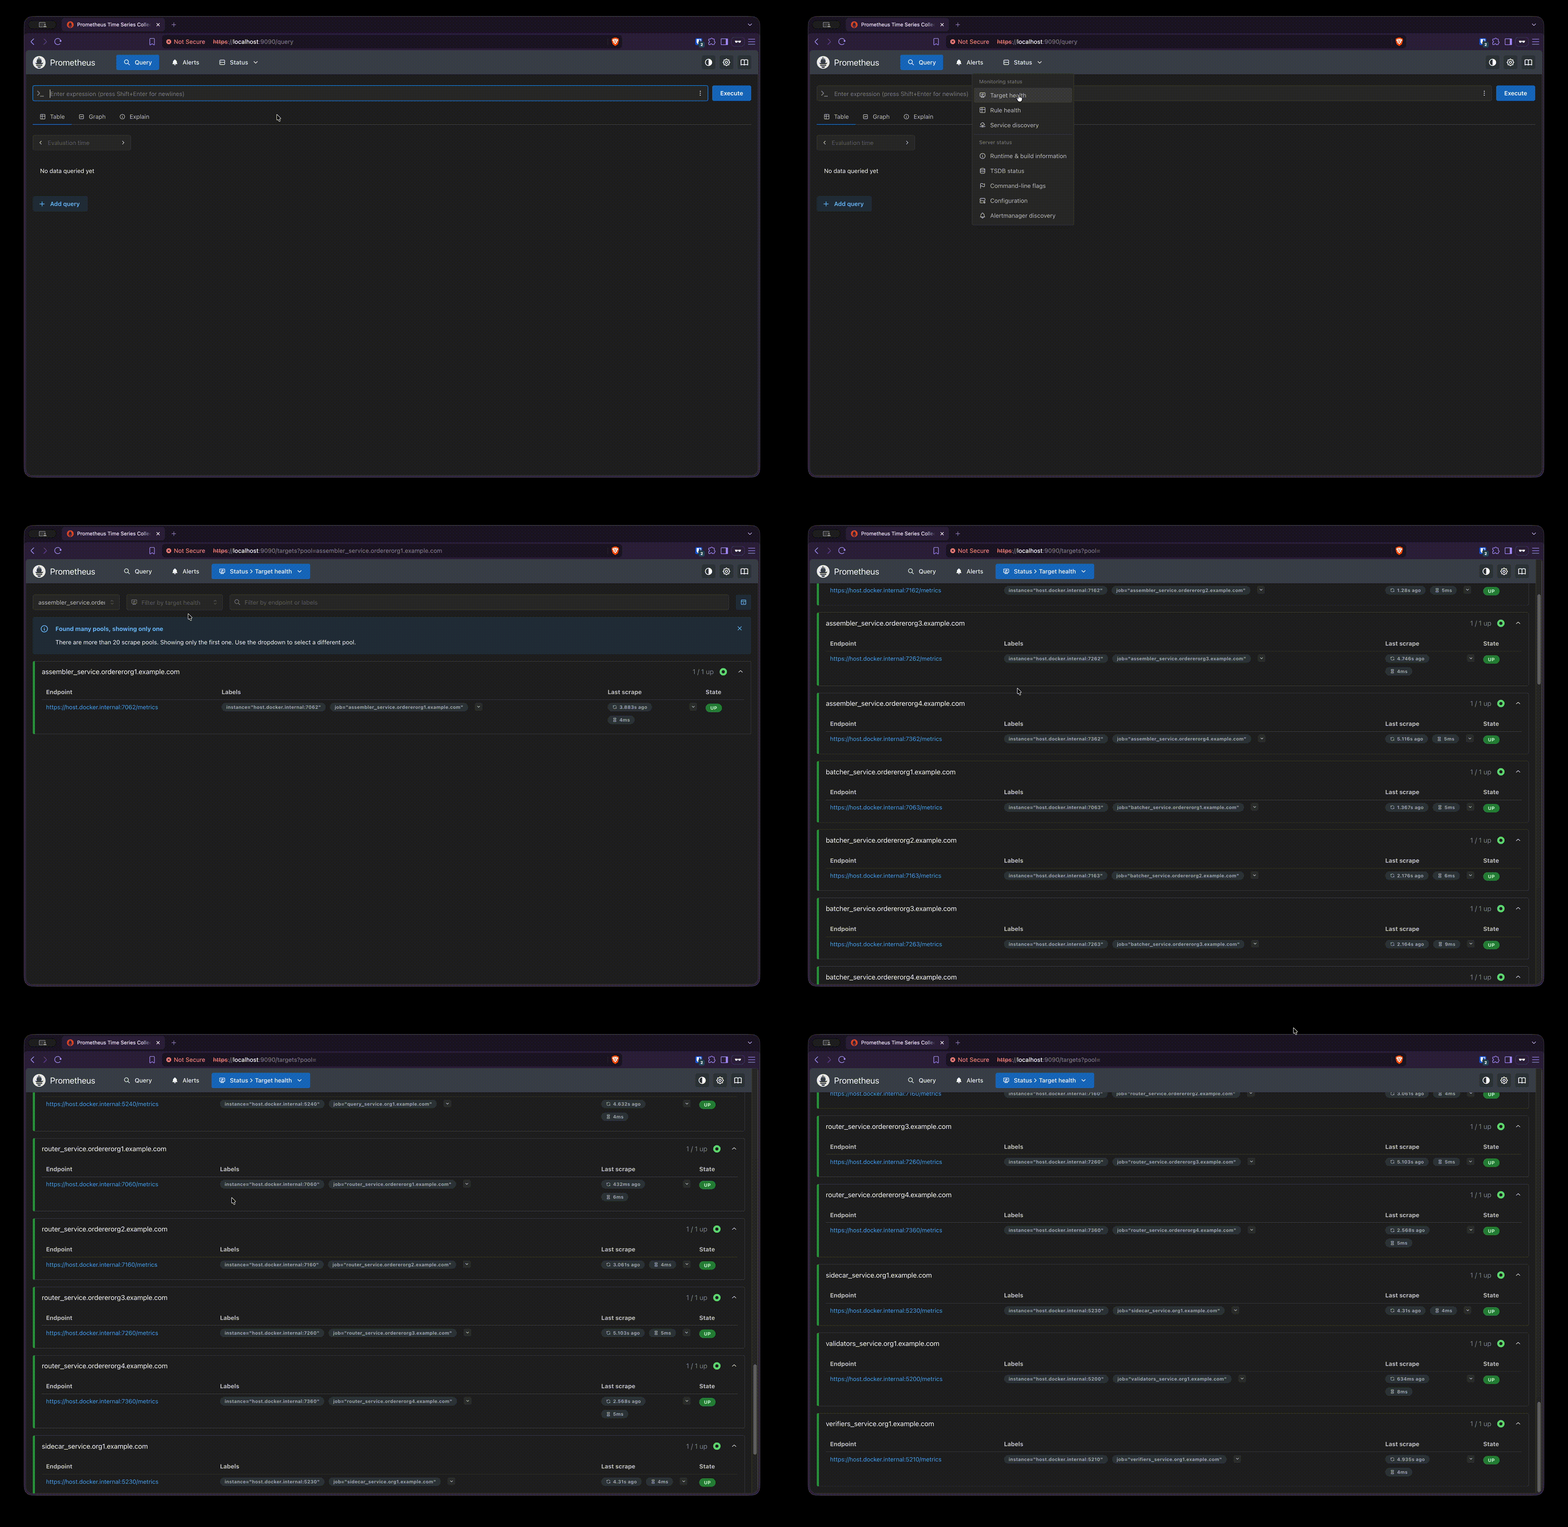
When a Grafana panel looks wrong, go one level down and query Prometheus directly at https://localhost:9090 — again https, because the inventory sets prometheus_use_tls: true.
The Status → Targets page is the single most useful page in this whole stack. It lists every scrape target and whether it is UP. A component that failed to start, or whose metrics port is misconfigured, or whose mTLS client certificate was not accepted, shows up here as DOWN with the reason.
Tip
Prometheus scrapes the Fabric-X components over mTLS. That is what the orderer_operations_mtls_clients: [prometheus] and committer_monitoring_mtls_clients: [prometheus] lines in the inventory are for — they tell each component to trust prometheus as an mTLS client. Remove them and every Fabric-X target goes DOWN.
Block Explorer: Your Own Blocks
Open http://localhost:18000 — this one is plain http.
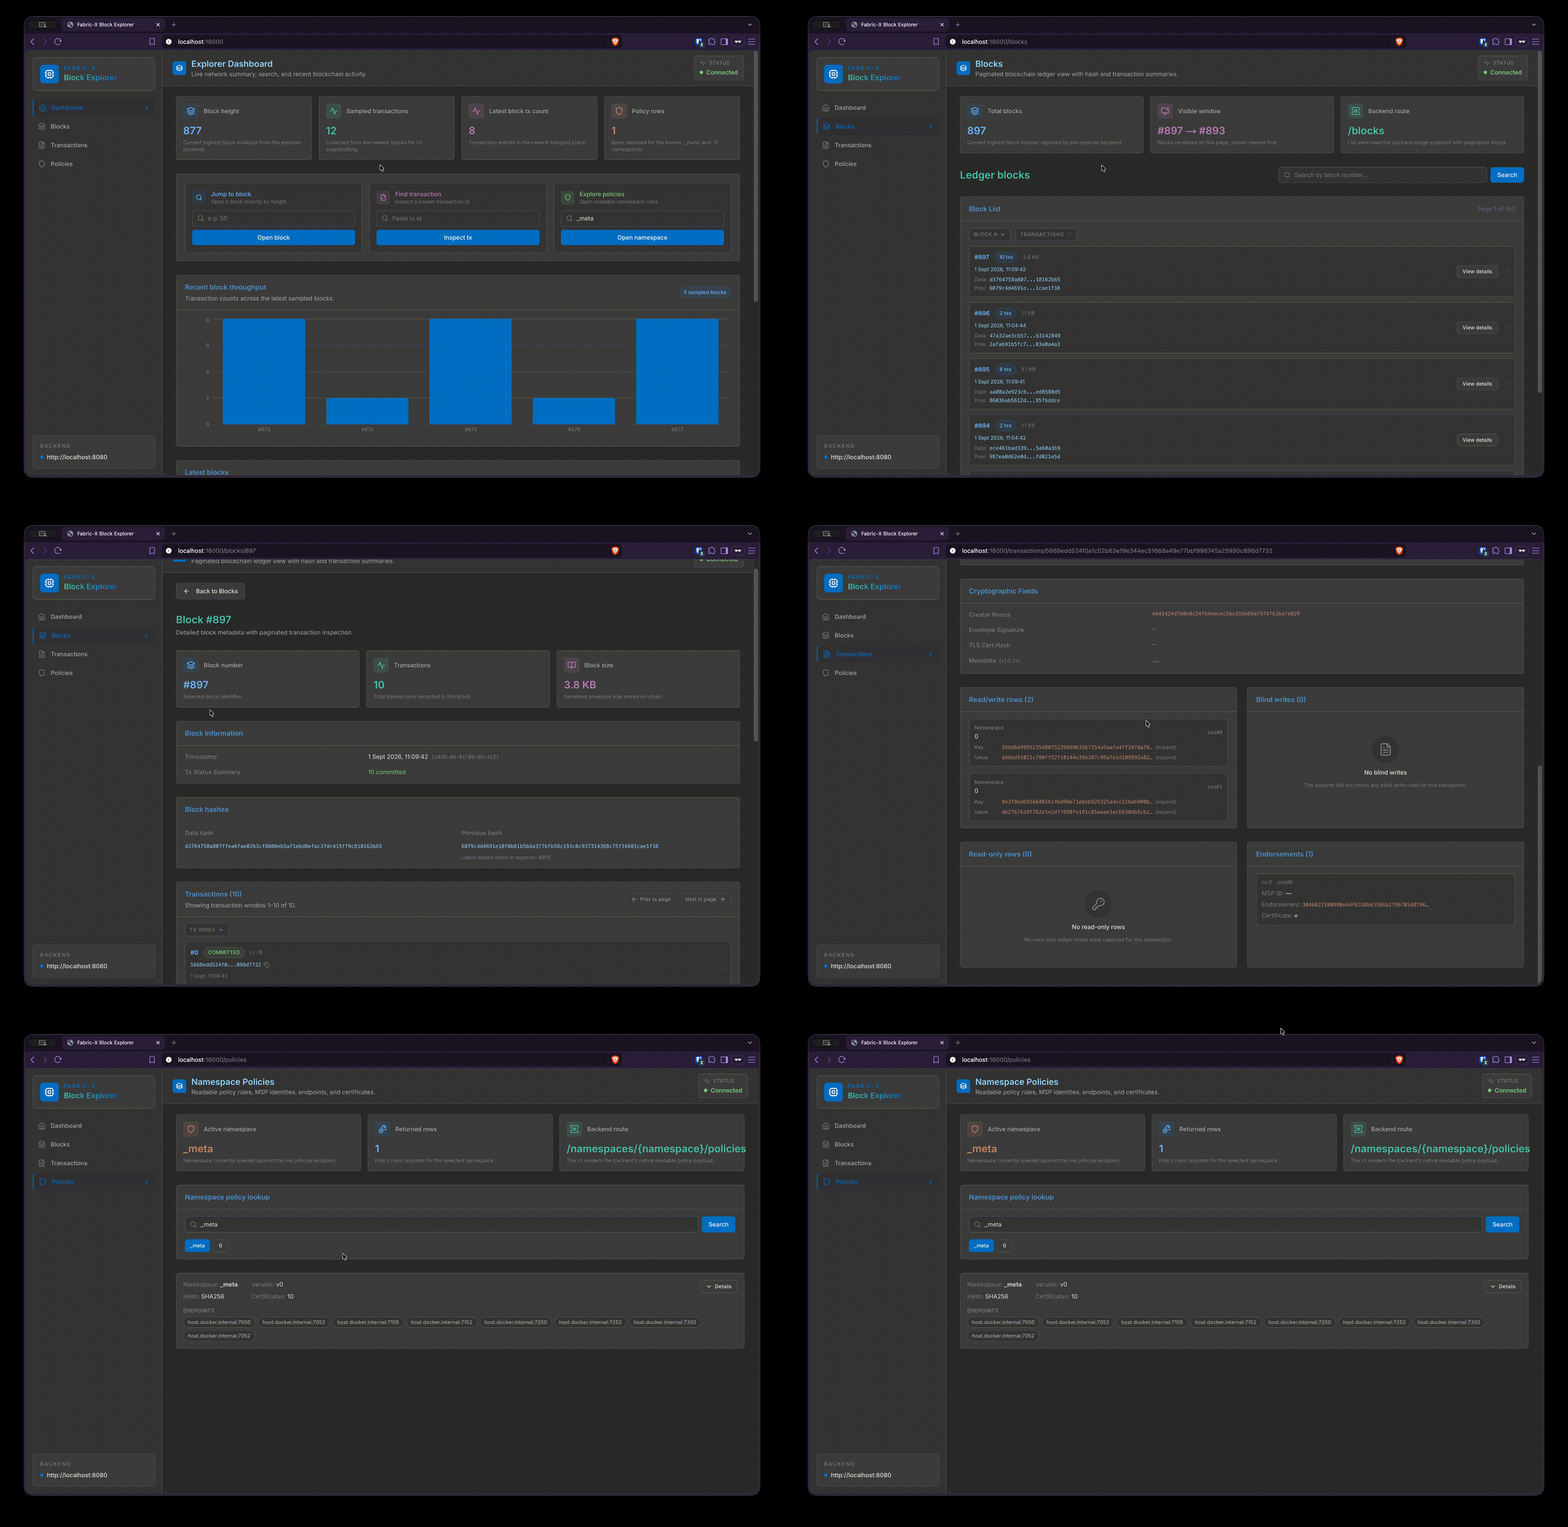
The Block Explorer streams blocks over gRPC from the committer sidecar, indexes them into its own PostgreSQL database, and gives you a browsable view: blocks, their transactions, and each transaction's status.
Its topology is worth understanding, because it is a good example of how the inventory wires services together:
flowchart LR
  SC[committer-sidecar] -->|gRPC block stream| BE[block-explorer]
  BE -->|indexed blocks| DB[(block-explorer-db)]
  BE --> UI[Explorer UI on :18000]
Three inventory lines on the block-explorer host make that happen:
| Variable | Value | Meaning |
|---|---|---|
sidecar_host |
committer-sidecar |
Which host to stream blocks from |
postgres_db_host |
block-explorer-db |
Which database to index into |
block_explorer_ui_port |
18000 |
Where the UI listens |
There is a subtlety here that catches people: the Block Explorer's TLS/mTLS mode is not a local flag. It is derived from the committer_use_tls and committer_use_mtls settings of the host named by sidecar_host. And the committer must be told to trust it, which is what committer_mtls_clients: [block-explorer] does in the committer group variables.
Use the Explorer to confirm the network is doing real work: pick a recent block, open it, and look at the transactions the load generator submitted into namespace 0.
Metrics from the Command Line
You do not need a browser. From the repository root:
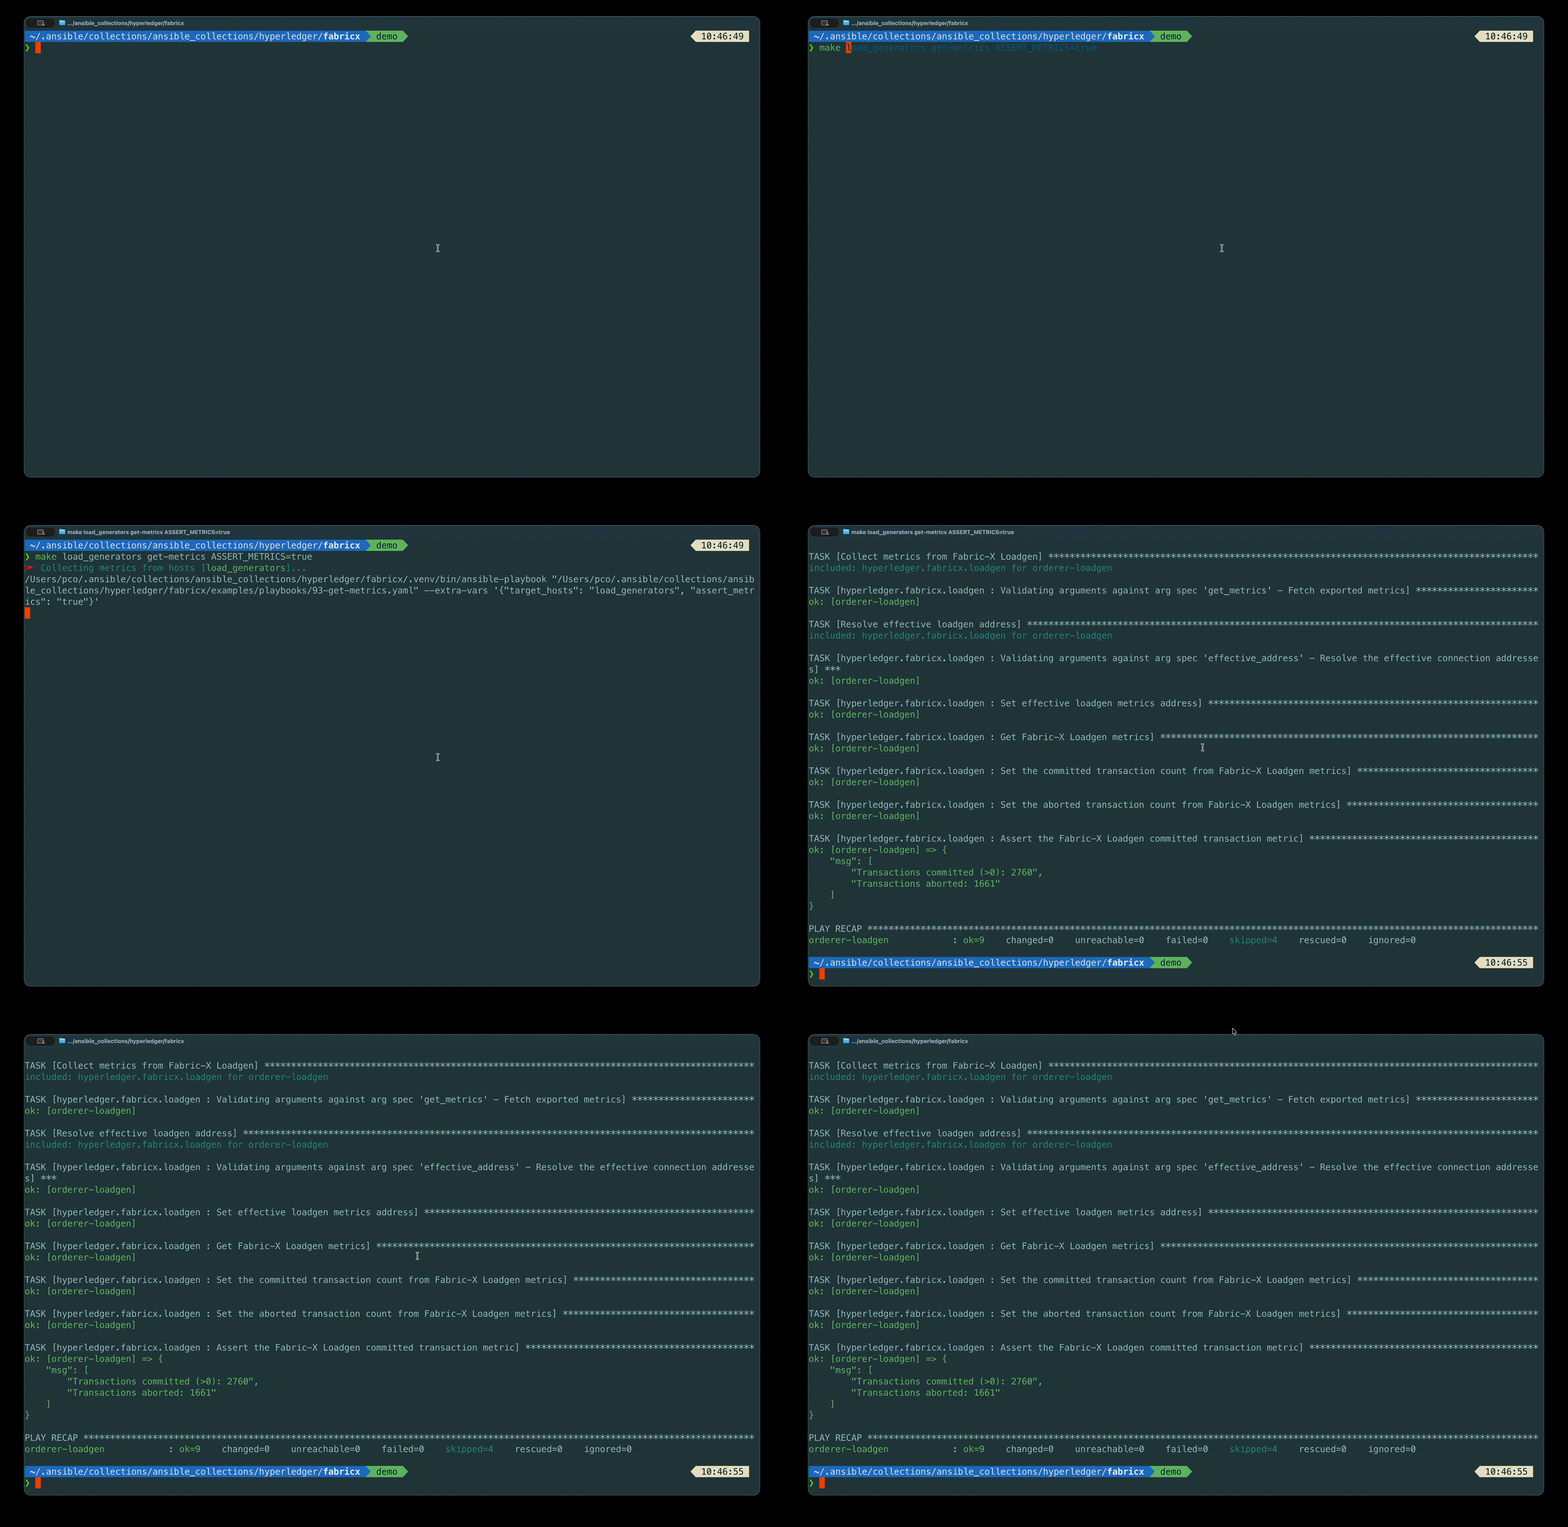
This scrapes every component that exposes metrics and prints the result. Restrict it to the component you care about:
For scripting and CI, turn it into an assertion that fails on an unhealthy component:
And the cheapest check of all, when you only want to know whether things are listening:
Logs from the Command Line
Alloy is already shipping every container's logs into Loki, so Grafana's Explore view is the richest way to read them.
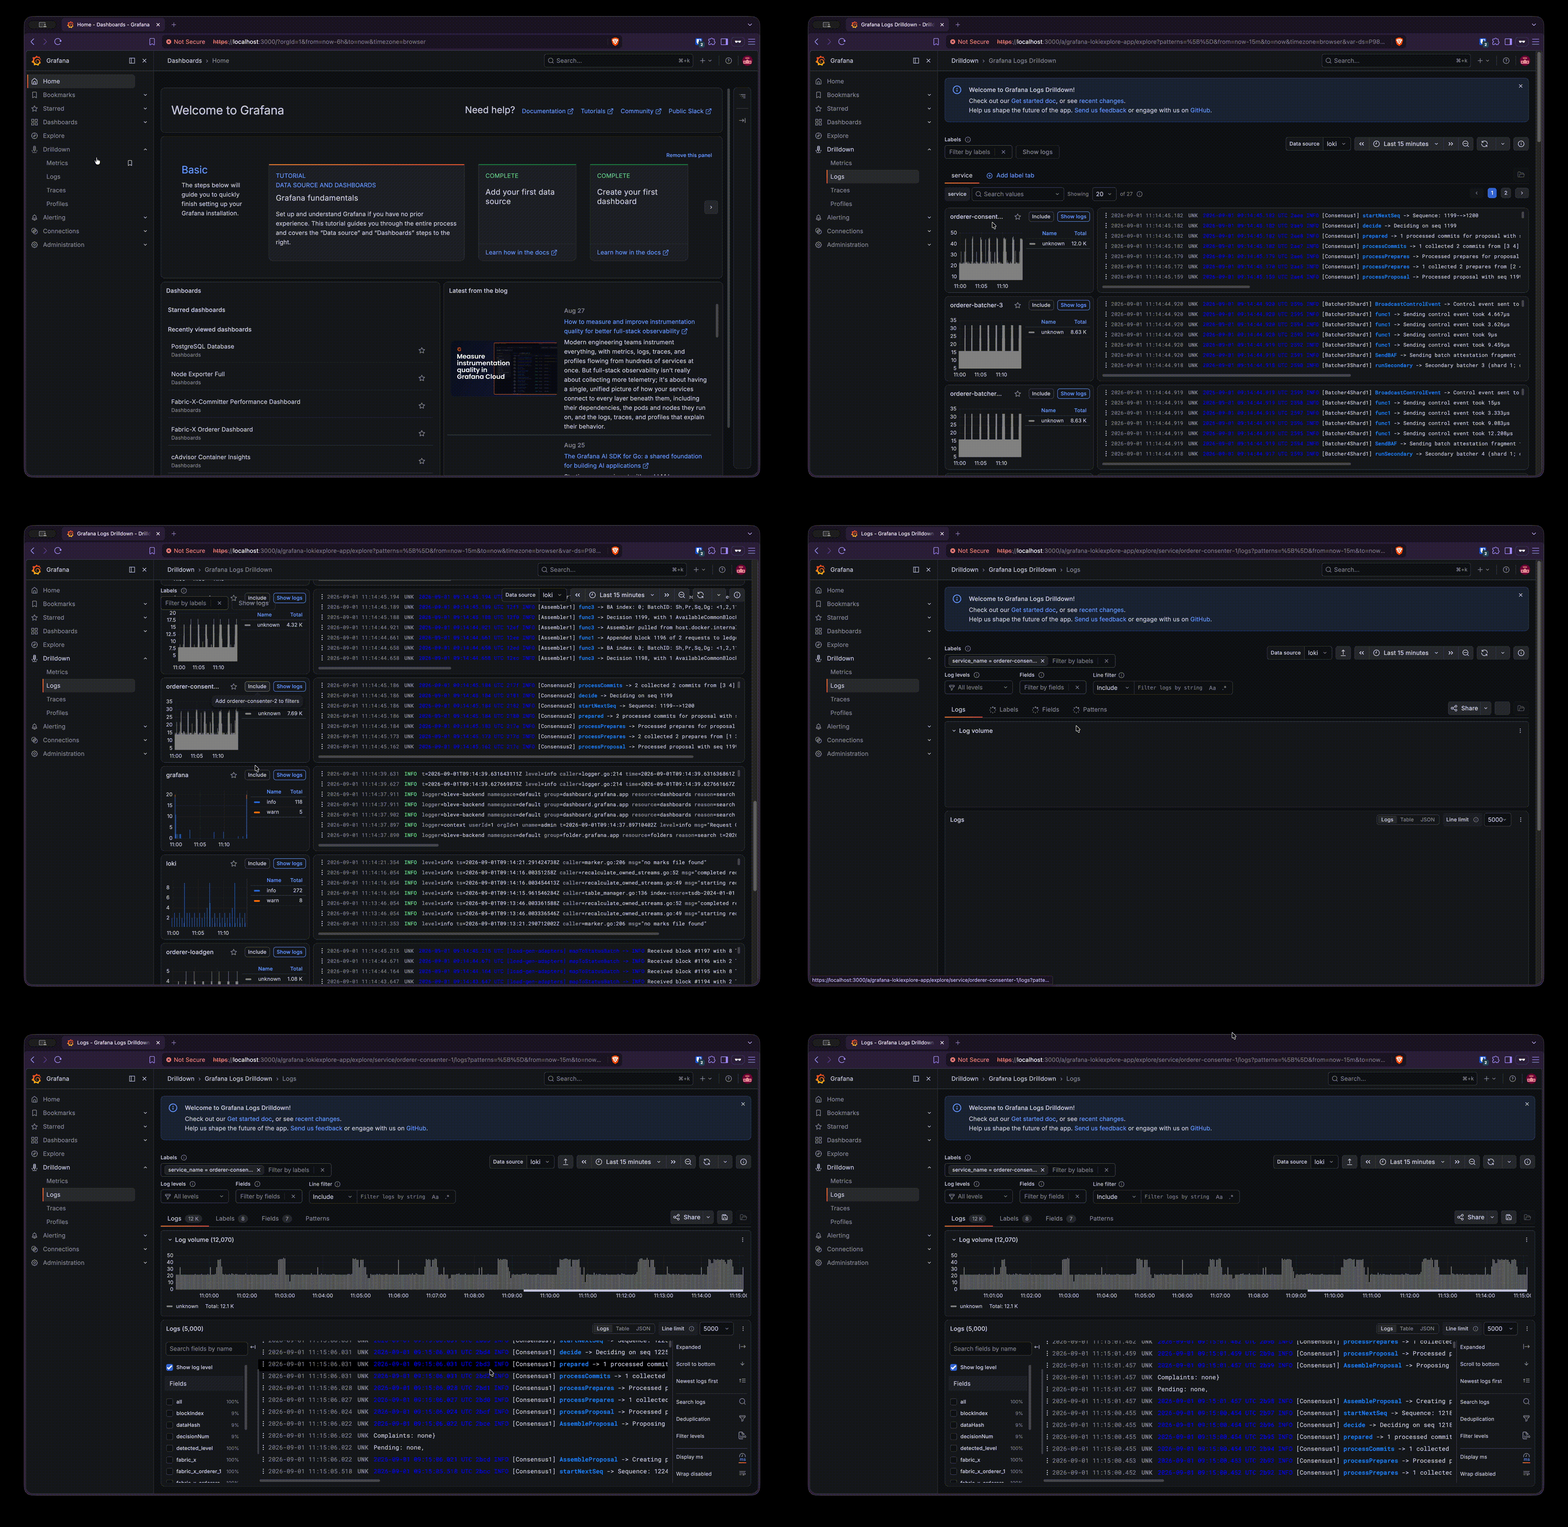
But when you want log files on disk — to attach to a bug report, or to grep offline — collect them:
Logs land under out/control-node/fetched/. As with everything else, you can narrow the scope:
Note
That second form — targeting a single host by name — only works after you have run make targets once. Lesson 6 explains why.
For a quick look at one container without collecting anything, the container engine is still the fastest route:
Change the Load
Here is the fun part. The load generator's submission rate can be changed on a running network, without regenerating any configuration:
Watch the Committer Performance Dashboard in Grafana. Within a scrape interval or two, the commit rate follows.
Then push it up:
Now watch what saturates first. Depending on your machine, you will see the orderer keep up while the committer's commit rate plateaus below the submission rate, or you will see cAdvisor showing one container pinned at its CPU limit. Either way, you have just found your local bottleneck — and you now know which component to scale.
Note
make limit-rate defaults LIMIT to 1000 if you omit it. If an inventory never sets loadgen_limit_rate at all, the load generator starts at the role default of 10 transactions per second.
Exercise
Tip
Two parts.
- Drop the transaction rate to 50 TPS, confirm in Grafana that the committer's commit rate follows it down, then raise it back to 1000.
- Without opening a browser, find out whether the committer sidecar is currently healthy — and if Prometheus has any scrape target that is
DOWN, work out which one and why.
Solution
Part 1:
make limit-rate LIMIT=50
# watch https://localhost:3000 → Fabric-X-Committer Performance Dashboard
make limit-rate LIMIT=1000
Part 2 — health of the sidecar, from the command line:
make fabric_x_committers ping          # is the port open at all?
make fabric_x_committers get-metrics   # is it reporting sane numbers?
docker logs --tail 50 committer-sidecar
For the Prometheus targets, the browser page is at Status → Targets, but you can also ask Prometheus over its API. Because the endpoint is TLS with a self-signed certificate, you need -k:
curl -sk https://localhost:9090/api/v1/targets \
  | python3 -c "import json,sys; [print(t['health'], t['labels'].get('instance')) for t in json.load(sys.stdin)['data']['activeTargets']]"
The two usual causes of a DOWN Fabric-X target:
- The component is not running —
make pingwill also fail for it. - The component does not trust
prometheusas an mTLS client. Prometheus scrapes Fabric-X components over mTLS, so a component whose group variables are missingorderer_operations_mtls_clients: [prometheus]orcommitter_monitoring_mtls_clients: [prometheus]will refuse the connection even though it is perfectly healthy.
That second case is a good illustration of the theme of the next lesson: almost everything that looks like a runtime bug is really an inventory statement.
Next
| Previous | Next |
|---|---|
| 3. Run Your First Network | 5. Read the Inventory |